Measurement Products
Our products cover every step of your private asset data, from extraction to valuation and analytics, and each one feeds the next in one seamless workflow.

Alts-Align
Daily Valuation
A top-down nowcast of fund NAVs, every trading day.
- NAV Estimate
- GP mark
- Custom proxy
- Industry-leading holdings-level accuracy
- Fully automated end-to-end process
- For every private asset strategy and asset type
- Preserves the diversification effect
Calibrated to market daily with hyper-specific benchmarks.
Alts-Align rests on FEV's peer-reviewed research, published in The Journal of Portfolio Management and The Journal of Financial Data Science, and on a valuation process proven over 10 years.
 Introducing Objective Benchmark-Based Attribution in Private EquityThe Journal of Financial Data Science, 2019
 Improving Investment Operations through Data ScienceThe Journal of Portfolio Management, 2018
 Daily Valuation of Alternative Assets in DC PlansDCALTA, 2021
 An Economic Case for Transparency in Private EquityWorking paper, 2021
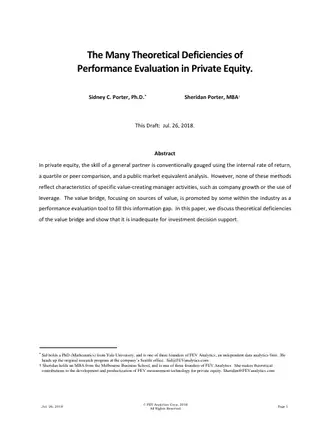 The Many Theoretical Deficiencies of Performance Evaluation in Private EquityFEV Analytics, 2018
Holdings-Level Portfolio Monitoring
Huginn filters signal from noise across the world's sources, surfacing developments that may materially impact company valuations. It works with Alts-Align, so what it finds shows up in your daily valuations, not at the next GP report.
- Portfolio monitoring
- Due diligence
- Reputational risk
Performance & Attribution
See how every manager really performed, and why. Filter by manager, sector or partner, break returns down into what drove them, and compare managers and partners side by side, all in a report for your investment memo.
- Fund I
- Fund II
- Fund III
- Benchmark
Public market equivalent (PME)
Each fund's track record against the public markets, gross or net of fees. Because we value the holdings ourselves, the comparison never leans on the GP's own marks.
Waterfall
See where the value was really created, from revenue growth and margins to leverage and multiples, for a whole manager or any slice of it, by fund, sector, region, vintage or deal.
Trend analysis
Watch how a manager's returns and what drives them change over time, from one fund to the next and across sectors and regions, and see whether its style really holds.
Agentic Analytics
Work with your data in your own words, not through an overlay.
- Question:
Run a performance and attribution analysis on the fundraising workbook we just received and show me where most of the alpha came from.
- Answer:
Mostly capital structure. It adds the most active return in Funds I, II and III and across all four. Operations held Funds I and II back.
Attribution of active returns, Ostergate Buyout Funds I to IVIllustrative, log active returns- Fund I
- Fund II
- Fund III
- Fund IV
- All funds
- Question:
Which type of companies drove the returns?
- Answer:
Big companies, where leverage drives the return. More of the GP's assets sit in leveraged mega-caps than anywhere else.
GP investment style, Ostergate Buyout Funds I to IVIllustrative, shaded by assets
Talking to your data in natural language
Ask a question in your own words, without writing a single SQL query, and get the answer back as a table or a chart.
Downloading plugins
Bring the data into the tools your team already uses.
Beautiful visualizations
Every estimate appears as a chart that you can read quickly and trace to the holdings behind it.
Open to your agents
Your own agents can reach the same data directly, because everything is built to work the way agents do.
Questions
- How do the products work together?
- They plug into each other in a single workflow. We handle the data seamlessly on our side, so it is not moved again between products.
- Who uses each product?
- Valuation and operations teams use Daily Valuation, investment teams use Performance & Attribution, investment, monitoring and risk teams use Portfolio Monitoring, and operations and data teams use Data Extraction.
- How does monthly valuation work?
- We run a first valuation the day after month-end, then run it again every day with any new GP statements until your close, so statements that arrive late still count toward that month. After the close we prepare the reports your valuation committee reviews.
- Which vehicles do you value?
- Today we value SEC-registered interval funds and tender offer funds, evergreen funds of funds and institutional mandates, monthly or daily, on the schedule each vehicle's NAV sets.
- Can we review the valuation assumptions?
- Yes. We share our methodology documentation during onboarding, and every output shows each adjustment to each fund step by step, from its last reported NAV to the estimate. On request we also show the companies in each proxy and the adjustments to each holding.
- Do the models learn on their own?
- No. Our valuation models are deterministic, so the same inputs always return the same value. Our data scientists maintain them through a formal change management process, and we keep the record of every run, so any past valuation can be reproduced and explained.
- Do you have relationships with GPs?
- No. FEV is independent. GP reports reach us through you or your service providers, such as a custody bank.
Breakthrough technology. Disruptive pricing.
The most direct test of a valuation method is to watch it run on a real portfolio.
We will value one of your portfolios.